You’re 10x More Likely to Win on Prediction Markets Than Sportsbooks
The comparison is straightforward: roughly 2–3% of sportsbook bettors win long term, while prediction-market data puts the winner range around 20–30%.
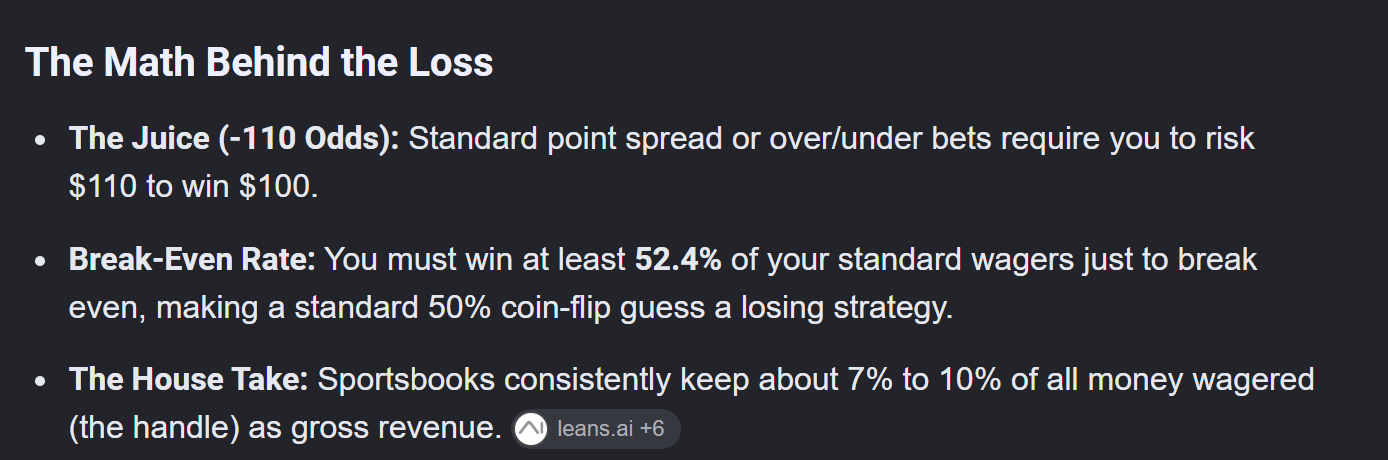
Only about 2–3% of sportsbook bettors win over the long run. Prediction-market reporting puts the profitable share closer to 20–30%. That makes a prediction-market participant roughly 10 times more likely to finish as a winner than a traditional sportsbook bettor.
The reason is structural. Sportsbooks build vig into prices and can limit consistently successful accounts. Prediction markets match participants against one another, publish transparent prices, and expose public trading history that can be studied directly.
The 2–3% vs 20–30% comparison
At standard -110 sportsbook odds, a bettor needs to win 52.4% of wagers just to break even. The built-in margin compounds across volume, making long-term profitability difficult even before mistakes, poor prices, and emotional decisions enter the picture.
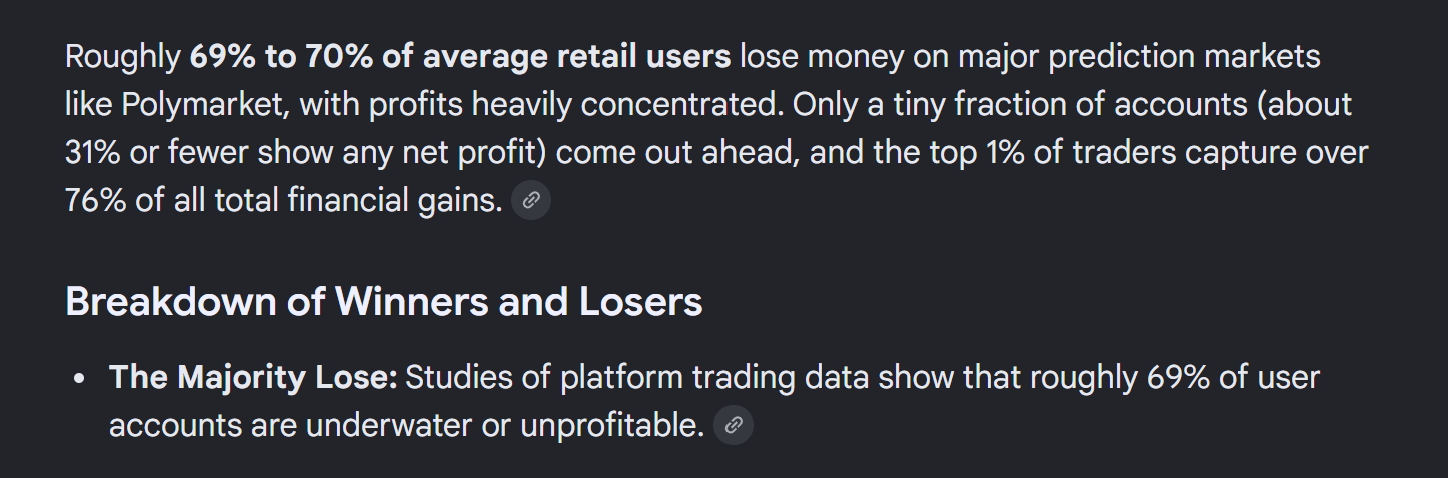
A 2026 wallet-level study found that 68.8% of Polymarket users lost money. In other words, roughly 31% finished in profit in that dataset. Other prediction-market samples and platform analyses place the profitable group closer to 20%, producing the roughly 20–30% range used in this comparison.
Why prediction markets create a better starting point
Prediction-market prices represent the market's current probability estimate. You can compare that probability with another venue, your own research, or a trader's public history. That visibility makes it easier to identify disagreement and measure whether a price is attractive.
Public leaderboards and on-chain records also make it possible to examine who has performed over time. Instead of taking a pick seller's screenshots on faith, you can inspect positions, volume, categories, and realized results.
- Transparent market prices can be converted directly into implied probability
- Public trading history makes long-term performance easier to evaluate
- Cross-market price differences can create arbitrage opportunities
- Participants can specialize in categories where they have an information edge
You are 100% more likely to be a winner if you are reading this
Reading the math, comparing the market structure, and building a process already separates you from participants who trade without a plan. The next step is to choose a strategy you can repeat and measure.
Start with Monster's top three prediction-market strategies: arbitrage, copy trading, and research-driven probability comparison.
Internal research path
Continue researching
Start with Monster
Prediction-market users are 10x more likely to win than sportsbook bettors
See the 2–3% vs 20–30% comparison, then use Monster to research prices, traders, and arbitrage opportunities.